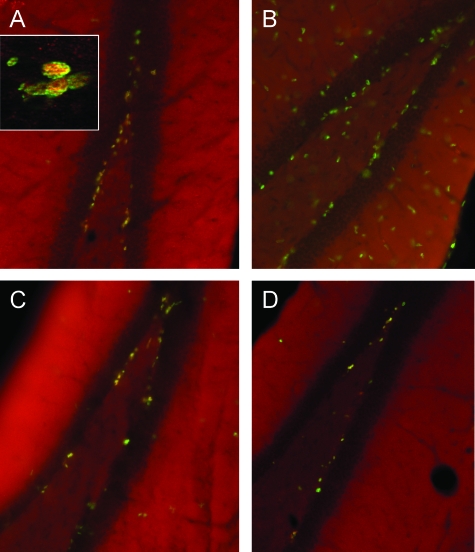
Figure 2.
Photomicrographs of mouse hippocampus 72 hours after ICV injection with vehicle (PBS) or LPS. Images are merged from immunofluorescence detection of Tbr2 (red) and BrdU (green). Yellow (colocalization, see inset) indicates a proliferative Tbr2+ cell while green indicates a proliferative Trb2− cell. The dark band is the dentata fascia. A: Wild-type mouse following ICV PBS. Tbr2 and BrdU are primarily colocalized as yellow SGZ nuclei with few Tbr2− proliferative cells. B: Wild-type mouse following ICV LPS. In contrast to A, note depletion of Tbr2+ cells and increase in Tbr2− BrdU+ (green) cells in SGZ and elsewhere, indicating a proliferative response among Tbr2− cells. C: EP1−/− mouse following ICV LPS. Tbr2+ cells were protected and appeared similar to A, accompanied by only partial increase in proliferative response among Tbr2− cells. D: EP2−/− mouse following ICV LPS. Tbr2+ cells were in between A and B, suggesting partial protection, with no apparent increase in Tbr2− cell proliferative response. Magnifications, ×20; inset, ×400.

