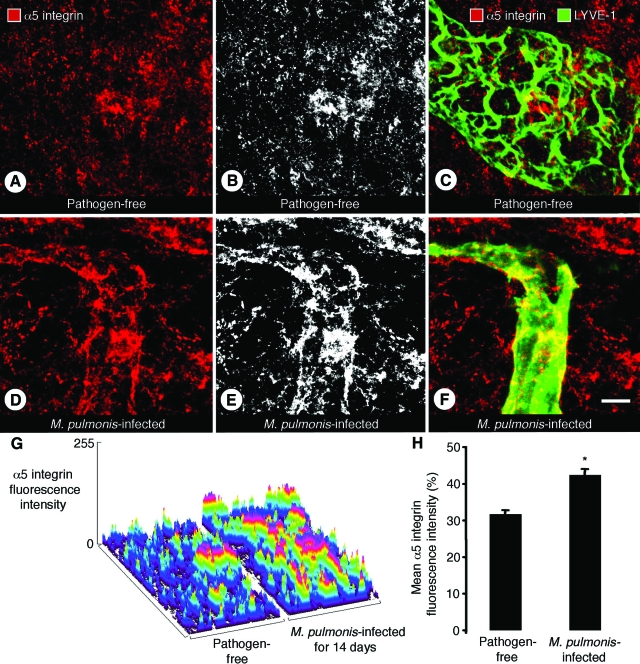
Figure 4.
α5 integrin immunoreactivity of lymphatics in infected tracheas. Confocal microscopic images of tracheal whole mounts, stained for LYVE-1 (green) and α5 integrin (red) immunoreactivities, from pathogen-free mice (A--C) or mice infected with M. pulmonis for 14 days (D–F). A–C: Absence of α5 integrin immunoreactivity (red) on a collecting lymphatic in a pathogen-free mouse shown by lack of colocalization with LYVE-1 (green). B: Gray scale image of A to highlight staining of the lymphatic. D–F: An initial lymphatic in an infected mouse showing patchy α5 integrin immunoreactivity. E: Gray scale image of D. G: Surface plot of the intensity of α5 integrin immunofluorescence in tracheal mucosa over a cartilage ring. H: Mean fluorescence intensity of α5 integrin in mucosa over cartilage rings in infected and pathogen-free mice. Values are means ± SEM *P < 0.05 compared with pathogen-free mice. Five mice per group. Scale bar = 10 μm.

