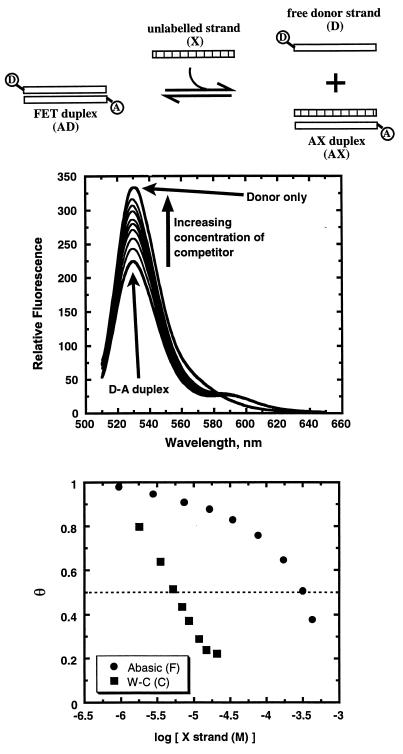
Figure 2.
Titration of the unlabeled competitor strand, X, disrupts the AD duplex. The top schematic represents the competitive equilibria described in the text. The top graph shows the fluorescence emission spectra throughout the titration. Note that the donor fluorescence increases as competitor strand is added. In this case, the competitor strand (5′CGCATGCGTACGC3′) has the same sequence as the donor strand, so fluorescence of the donor can be nearly completely restored. The lower graph shows a plot of θ versus the logarithm of competitor concentration for two different competitors: the unlabeled donor strand as a control (which forms a Watson-Crick duplex designated as C), and a strand with a tetrahydrofuranyl abasic site analogue (5′CGCATGFGTACGC3′), which is known to form a duplex (designated as F) with lower free energy (6). Note that both curves exhibit the expected sigmoidal shape. Note also that the poor competitor strand, with the abasic site, must be added in considerably higher concentration to achieve a comparable reduction in θ.

