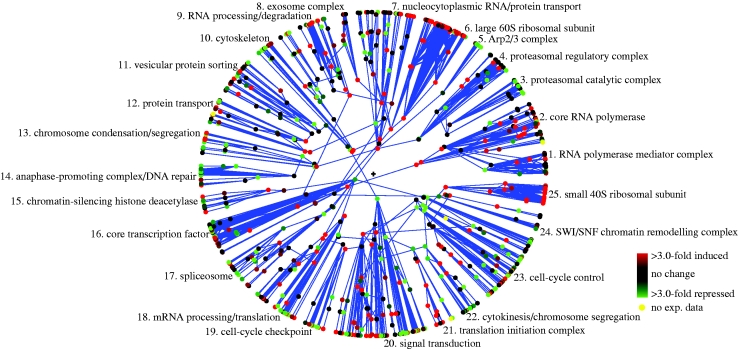
Figure 7.
Hydrogen peroxide oxidative stress versus heat shock gene expression response in S. cerevisiae. Analogous to figure 6, except that the colours now show hydrogen peroxide oxidative stress mRNA fold induction relative to heat shock stress. See the main text for analysis.

