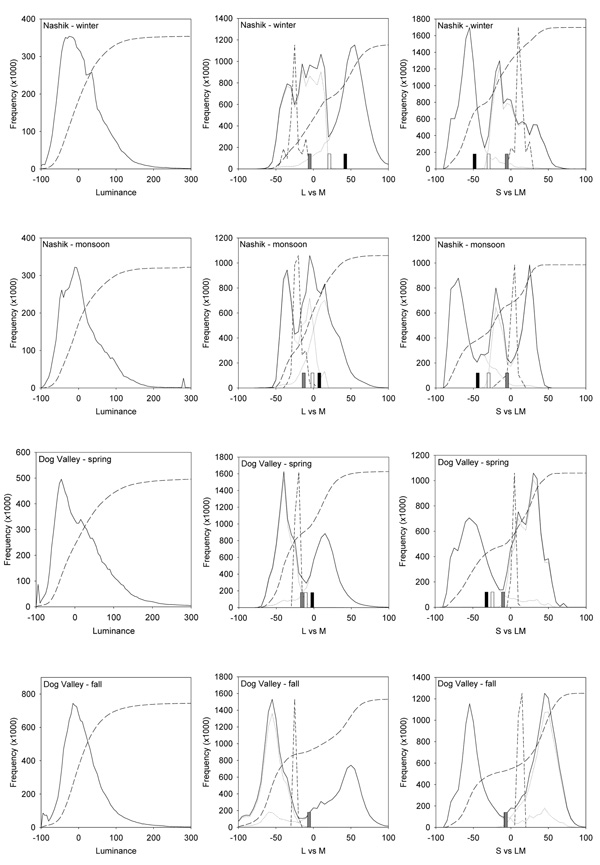
Figure 3.
Histograms of the Luminance, L vs M, or S vs LM contrasts for each environment. Solid lines show the distribution for all image pixels for luminance or for the two chromatic axes after equally weighting the sky and earth distributions. Dotted lines show the separate histograms for earth and sky, while medium dashed lines show the cumulative probability based on both image regions. Short dashed lines give the distribution of illuminant chromaticities, arbitrarily scaled to the same relative height. Bars for the chromatic distributions show the average L vs M or S vs LM chromaticity for the original images (black) or after weighting earth and sky equally (white) or in the ratio that provided a mean chromaticity closest to the nominal white (gray).

