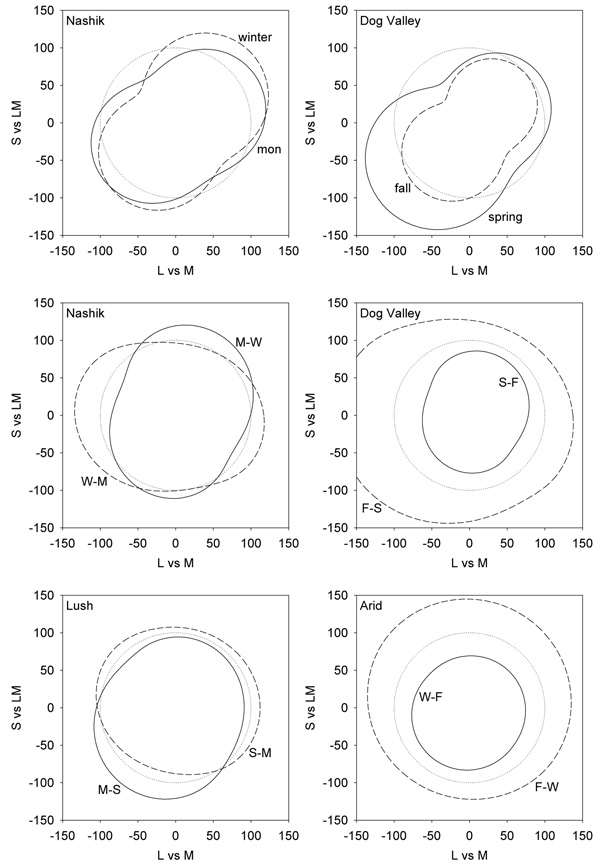
Figure 5.
Representations of perceived color contrast across the 4 different environments. Lines show the iso-contrast contours within a given environment if the model channels are adapted to give the same average response as to a reference environment. Top panels plot the response to the Nashik or Dog Valley settings when adaptation is equated for a uniform color distribution (dotted line). Middle panels show the shift in perceived contrast across seasons at the same locations. In this case the iso-contrast lines show the response to one setting (e.g. monsson) after adapting to equate average responses to the reference setting (e.g. winter). The reference is thus again shown by the uniform contour (dotted line). Bottom panels instead show the changes in perceived contrast across the two locations during comparable (lush or arid) seasons.

