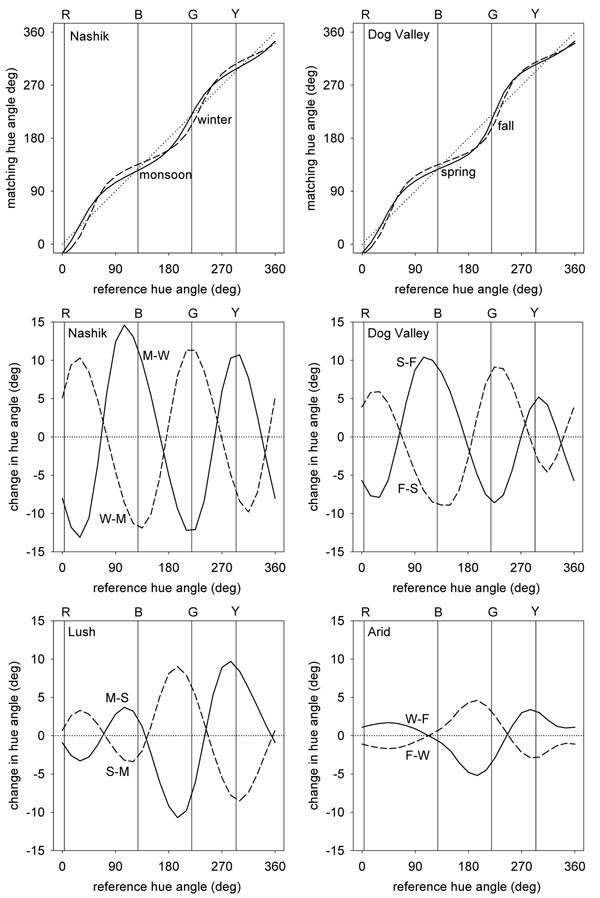
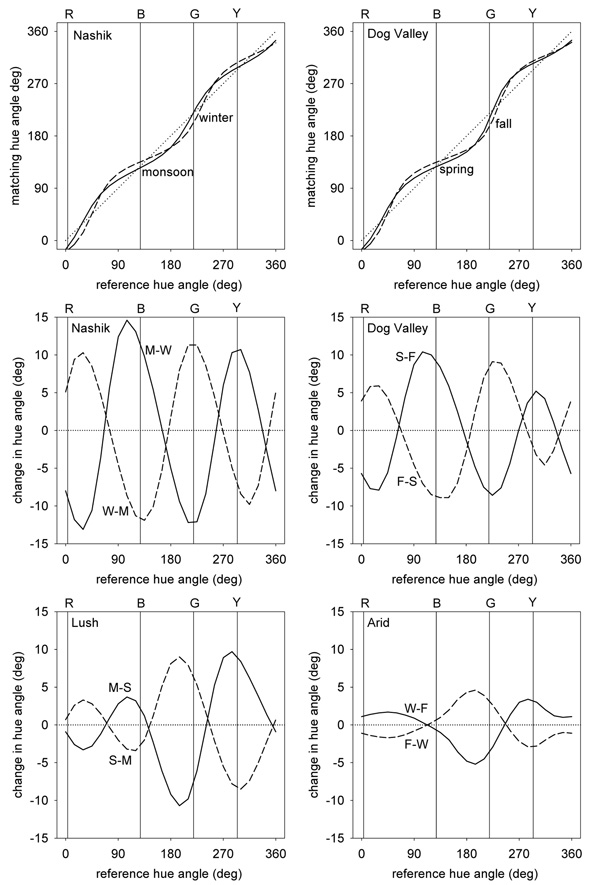
Figure 6.
Changes in perceived hue across the different settings. Top panels plot the hue changes for the 4 environments when the responses to each are adapted to equate them to the mean responses to a uniform distribution. Lines show the chromatic angle in the adapted environment that would match the hue of a given angle in the reference environment. Middle panels plot the predicted differences in hue angles for stimuli that would match in hue after adapting to different seasons, while lower panels plot the corresponding changes across different locations.


