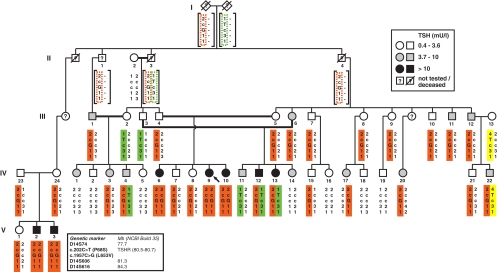
Figure 1.
Pedigree of the extended family with RTSH. The shadings of symbols indicate ranges of serum TSH concentrations as explained in the legend on the upper right corner. Subjects were tested for the indicated polymorphic markers. The haplotypes are shown below each symbol, and different colors help to trace the inheritance of the different alleles harboring the mutations, as indicated in the legend on the bottom left. Predicted haplotypes are in squared brackets.

