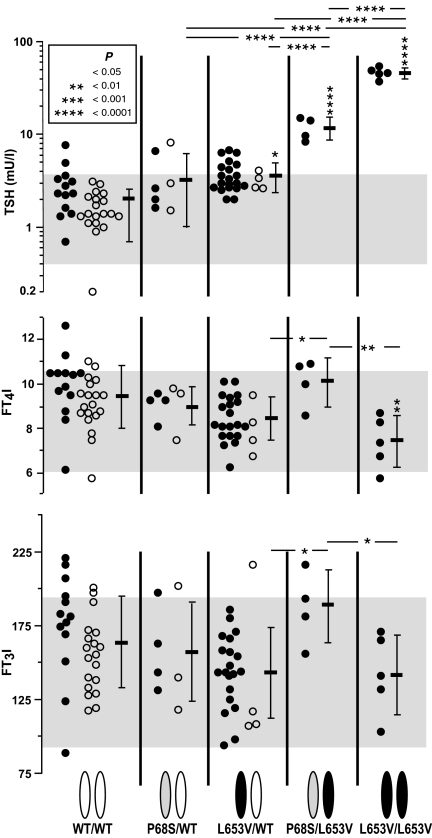
Figure 2.
Serum TSH (upper graph), FT4I (middle graph), and FT3I (lower graph) concentrations in individual subjects grouped according to the genotype indicated on the bottom of the figure. Closed symbols represent members of the extended family. Open symbols represent mutation carriers identified by screening the population and the corresponding normal WT controls matched for age and gender. Mean values ± sd for each genotype group are shown on the left of data points. Asterisks above the sd bar indicate P values for difference with the group expressing only the WT alleles.

