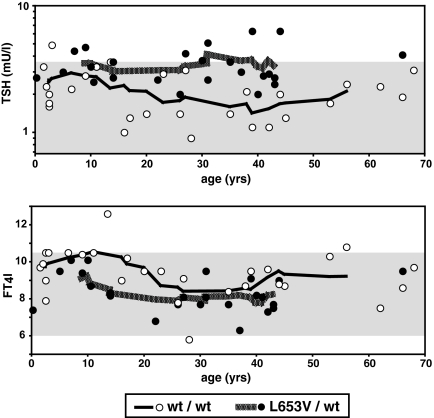
Figure 3.
Serum TSH (upper graph) and FT4I (lower graph) concentrations in individual subjects graphed according to age. Shaded areas are the respective normal ranges. Open symbols are homozygotes for the WT allele, and closed symbols are heterozygotes for L653V. Note that there is no trend of change with age for both parameters and in both genotypes.

