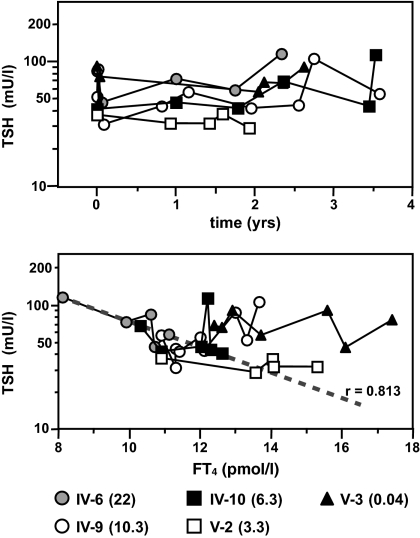
Figure 4.
Prospective longitudinal measurement of TSH and FT4 in the five subjects homozygous for the L653V mutation. The evolution of TSH over time is displayed in the upper graph. Individuals are identified by different symbols, and age at the time of the first measurement is given in parentheses in the key. Note that regression analysis showed no significant upward or downward trend of TSH with time (slope) for any of the individuals. In the bottom graph, TSH values are correlated to those of FT4. Note that only subject IV-6, with AITD, showed a significant (P < 0.02) reciprocal correlation between TSH and FT4. This is indicated by the regression line (dashed) plotted by the least mean square method for the five pairs of TSH and FT4 measurements in subject IV-6 over the 2.5 yr of observation.

