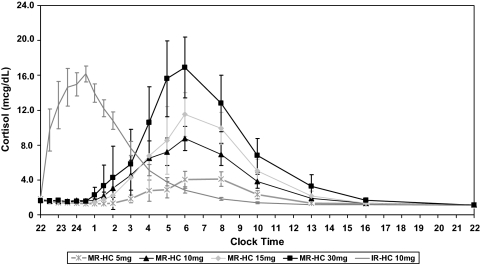
Figure 2.
Concentration-time profiles for MR-HC and IR-HC. Concentration-time profiles for different doses of MR-HC given at 2200 h compared with 10 mg IR-HC using geometrical means (±sem) of serum cortisol concentrations at 18 different time points over 24 h. Profiles of MR-HC show a prolonged Tmax, Tlag, and a lower dose-adjusted Cmax (data not shown) when compared with IR-HC, all typical of a formulation with delayed and sustained release characteristics. mcg, μg.

