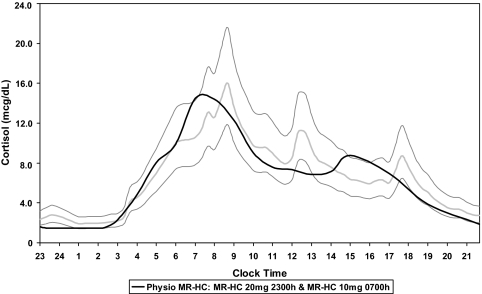
Figure 3.
Simulation of physiological (Physio) cortisol rhythm using MR-HC. Phase 1 PK data were used to simulate giving MR-HC doses at different times and once or twice daily. PK modeling included comparison of MR-HC with the physiological cortisol rhythm over 12 and 24 h, and at different time intervals (trapezoidal segments), using AUCs. The graph shows modeled concentration-time profile (−) obtained when giving 20 mg (15 plus 5 mg) MR-HC at 2300 h and 10 mg MR-HC at 0700 h superimposed on the physiological cortisol rhythm [geometrical mean (−) ± 2 sd values (−) of serum cortisol concentration calculated from 20 min sampling over a 24-h period in 33 healthy subjects].mcg, μg.

