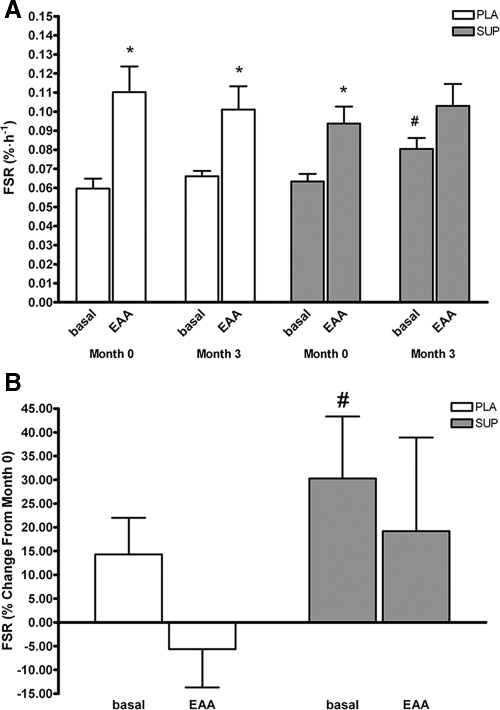
Figure 3.
A, Basal-mixed muscle FSR at months 0 and 3. Dotted lines are representative of pooled averages from both groups at month 0. B, Percent change in FSR from months 0–3. #, Significant increase in FSR from baseline to 3 months (P < 0.05). *, Significant increase in FSR after ingestion of an EAA bolus (P < 0.05). PLA, Placebo.

