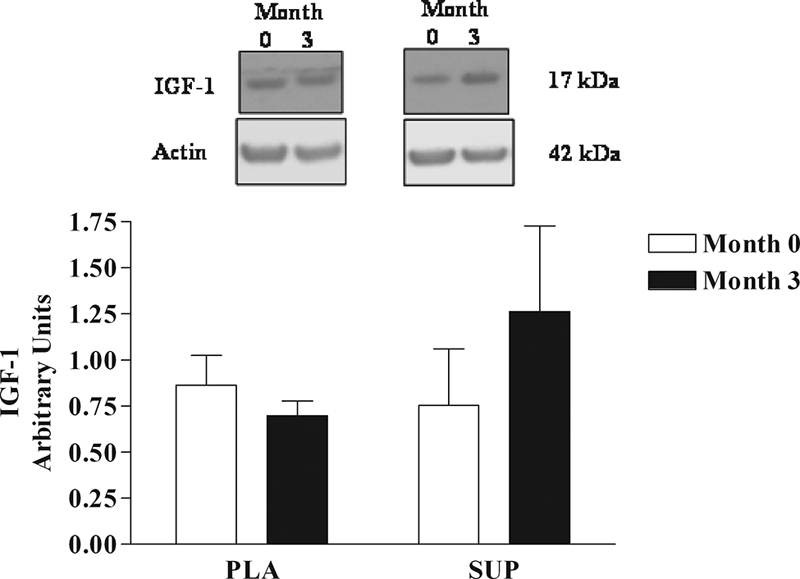
Figure 4.

IGF-I protein expression in skeletal muscle at months 0 and 3 of EAA supplementation. *, Significant increase in IGF-I expression in the SUP group (P = 0.05). Top, Representative Western blot from a placebo (PLA) and SUP subject. Bottom, Mean densitometry data from the seven subjects receiving 3 months placebo and seven subjects receiving 3 months 15 g EAA (SUP). Months 0 (white bars) and 3 (black bars). The arbitrary units result from the IGF-I densitometric data expressed as a ratio with the densitometric data for the actin control.
