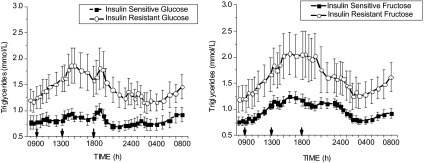
Figure 4.
TG responses to consumption of glucose-sweetened (left panel) and fructose-sweetened beverages (right panel) with meals in insulin-sensitive (n = 10, dashed line, round symbol) and insulin-resistant obese subjects (n = 7, solid line, square symbol). Plasma TG concentrations were significantly elevated after fructose consumption in both insulin-sensitive and insulin-resistant subjects (F = 5.1, P < 0.0001, treatment × time).

