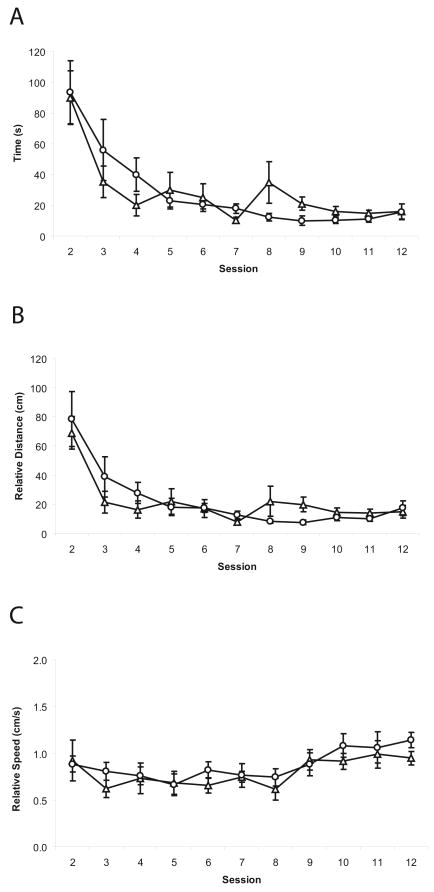
FIGURE 2.
Barnes maze test performed with 5-HT7+/+ (Δ) and 5-HT7-/- (○) mice. (A) Logarithmic decrease in time needed to locate the escape box with no difference in the time between 5-HT7+/+ and 5-HT7-/- mice throughout the experiment. (B) The relative distance traveled in order to locate the escape box. (C) Relative speed of 5-HT7+/+ and 5-HT7-/- mice. Values are mean ± SEM. n = 8 per genotype.

