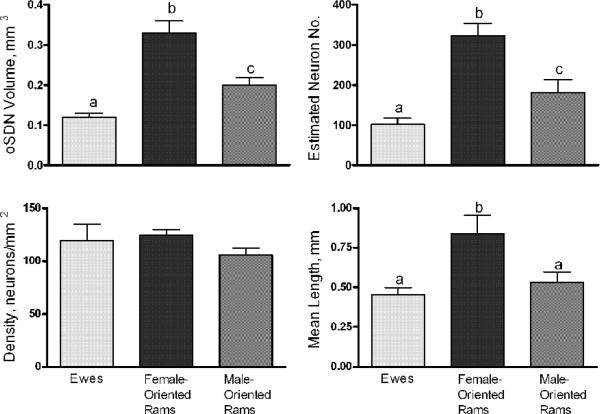
Figure 3.
Differences of the oSDN among female-oriented rams (n=8), male-oriented rams (n=9), and mid-luteal phase ewes (n=10). A, Differences in oSDN volume; B, Differences in neuron counts; C, Differences in neuron density; and D, Differences in oSDN length. Data are presented as means ± SEM. Bars with different letters differ significantly, P < 0.05. Reprinted from Roselli et al. (Roselli et al., 2004).

