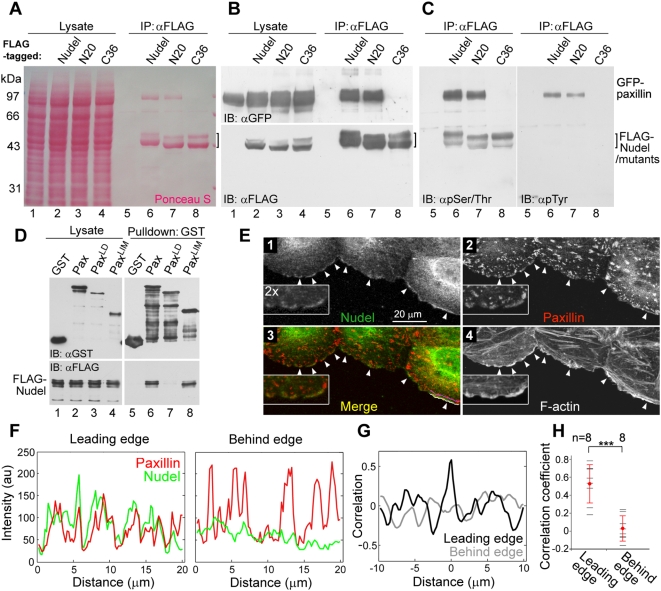
Figure 3. Interaction of Nudel with Paxillin.
(A–C) Co-IP was performed with HEK293T cell lysates containing GFP-paxillin and an indicated FLAG fusion protein. After SDS-PAGE and transfer, the membrane was stained with Ponceau S prior to immunoblotting (IB) with the indicated antibodies. Nudel or mutants usually display two bands due to phosphorylation in mitotic cells [61]. Hyperphosphorylated Nudel (the upper band) was preferentially recognized by anti-phospho-Ser/Thr antibody (C). (D) Direct interaction of Nudel with paxillin in vitro. FLAG-Nudel, GST, and GST-tagged paxillin or mutants were expressed in E. coli. Bacterial lysates containing the indicated proteins were mixed and precipitated with glutathione beads. A diagram for paxillin mutants is presented in Figure S4A. (E) Nudel colocalizes with paxillin at regions of membrane protrusion. ECV304 monolayers cultured overnight in serum-free medium were scratched and then incubated for 3 h in the presence of serum. Enlargements are included to show details. Arrowheads indicate representative positions of membrane protrusion. (F) Fluorescent intensity of paxillin (red) and Nudel (green) along the white line (Leading edge) and the purple line (Behind edge) in (E), panel 3. (G) Cross-correlation analyses on data in (F) indicate a strong correlation between the intensity trace of Paxillin and Nudel at the leading edge and no correlation approximately 2 µm behind the edge. (H) Significant correlation of Nudel with paxillin at the leading edge. Statistic analyses were done using correlation coefficients obtained from eight different regions (arrowheads) in (E) as demonstrated in (F and G). Error bars show SD. Asterisks indicate p<0.005.

