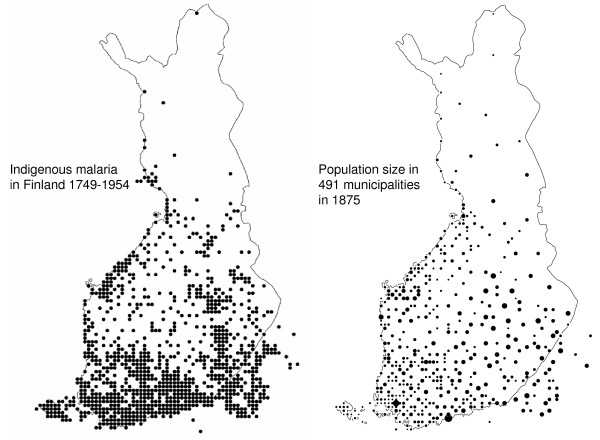
Figure 2.
Left map. Distribution of cumulative indigenous malaria cases Finland in 1749–1954. Dots represent 10 × 10 km2 units. Right map. The size of population in the municipalities in 1875 is presented according to the relative size of dots. The distribution of malaria comprised nearly all the inhabited parts of Finland.

