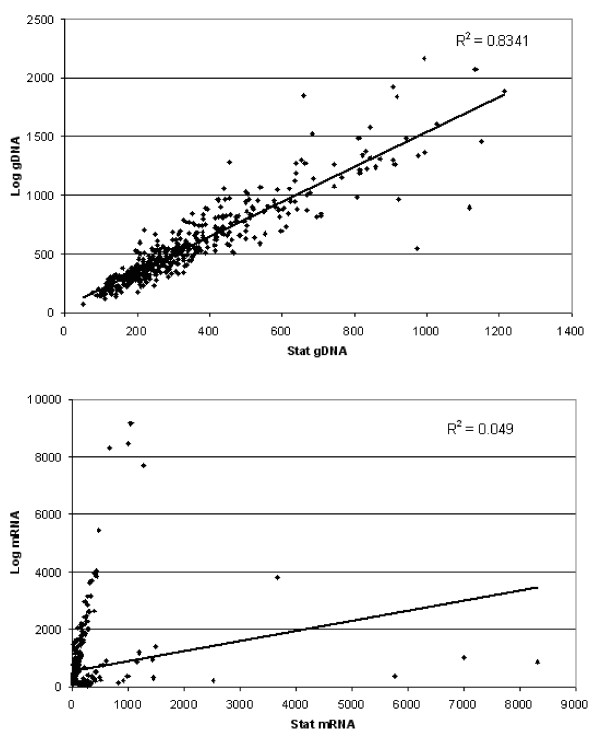
Figure 2.
Fluorescent signal values of B. melitensis transcript or gDNA from differentially expressed genes at stationary and late-log phases of growth. Average Cy5 (gDNA) or Cy3 (transcript) signal values for B. melitensis grown in F12K tissue culture medium to late-log and stationary phases (4 arrays each) were plotted in Excel. Each dot represents the signal value for an individual spot on the array, determined to be significantly differentially expressed between late-log and stationary phases. (A) Comparison of genomic DNA levels of significant genes at stationary and late-log phases of growth. Stationary phase gDNA signal values are on the ordinate, and late-log phase signal values are on the abscissa. The R-squared value (0.8341) is displayed in the upper right-hand quadrant of the graph. (B). Comparison of transcript levels of significant genes at stationary and late-log phases of growth. Stationary phase transcript signal values are on the ordinate, and late-log phase signal values are on the abscissa. Note the very low R-squared value (0.049), displayed in the upper right-hand quadrant of the graph. Stat refers to stationary phase, log refers to mid-log phase, and gDNA refers to genomic DNA.

