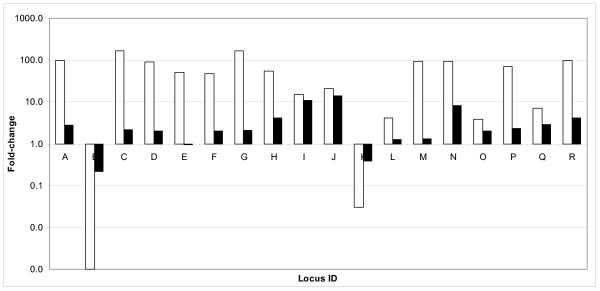
Figure 3.
Validation of DNA microarray results by quantitative RT-PCR. Eighteen randomly selected ORFs that were differentially expressed based on microarray analysis between late-log and stationary growth phase were validated by quantitative RT-PCR. Seventeen of 18 ORFs tested showed fold-changes in the same direction by both methodologies and 15 of them were also altered greater than 2-fold. Functional classifications are as follows (tested loci in parentheses): A, DNA replication, recombination and repair (BMEII0663); B, Transcription (BMEI1384); C, Translation, ribosomal structure and biogenesis (BMEI1798); D, Nucleotide metabolism (BMEI0608); E, Carbohydrate metabolism (BMEI0344); F, Lipid metabolism (BMEII0047); G, Amino acid metabolism (BMEI0730); H, Secondary metabolites biosynthesis, transport and metabolism (BMEII0079); I, Energy production and conversion (BMEI0475); J, Inorganic ion transport and metabolism (BMEII1120); K, Cofactor transport and metabolism (BMEI0842); L, Cell envelope, biogenesis and outer membrane (BMEI0402); M, Membrane transport (BMEI0642); N, Defense mechanism (BMEII0382); O, Signal transduction (BMEI2034); P, Post-translational modification and secretion, protein turnover and chaperones (BMEI0645); Q, Cell division (BMEI0073); R, Cell motility and chemotaxis (BMEII0150). Open bars indicate microarray fold-change, solid bars indicate qRT-PCR fold-change.

