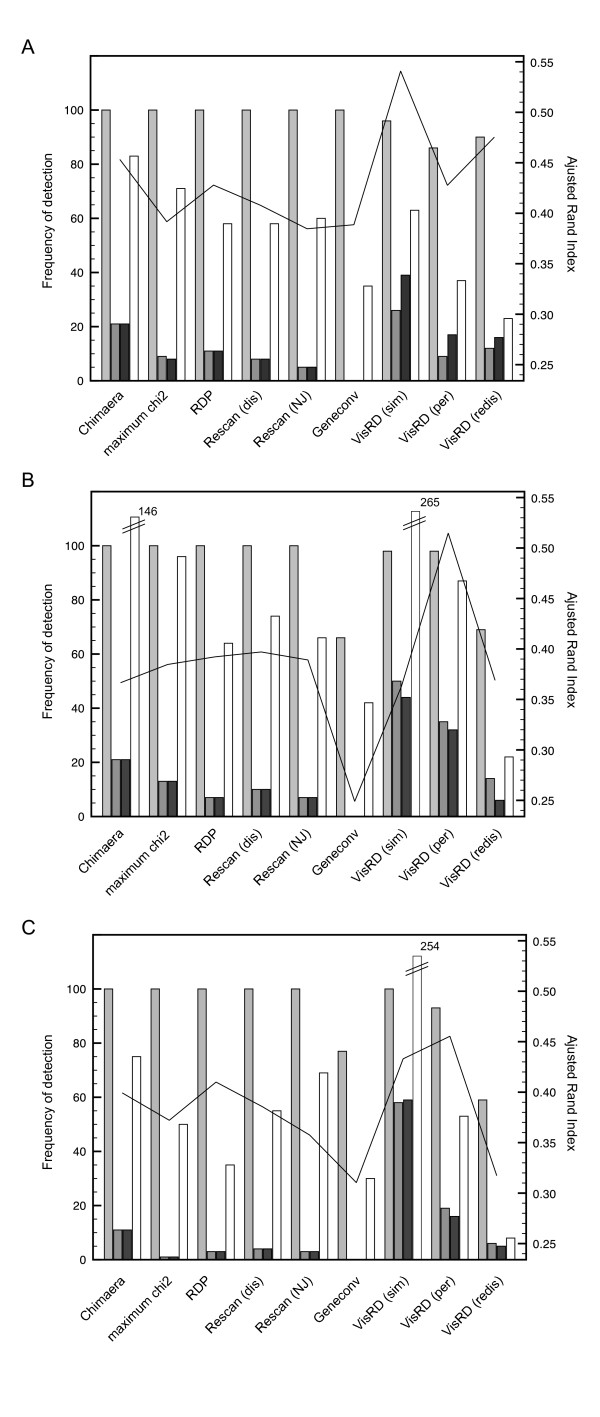
Figure 5.
Performance of triplet-based and quartet-based methods in recombination identification. Frequency of correctly identified recombinants and false positives in simulated data sets in the absence (a) and presence of rate variation among 1000 nucleotide partitions (b) and 800 nucleotide partitions (c). The latter rate variation scheme is not correlated with the breakpoint distribution. The four bars per method represent the frequency by which taxon 3 (light grey), taxon 11 (dark grey) and taxon 12 (black) were correctly identified as recombinants and the number of incorrectly identified recombinants (white) in 100 simulated data sets of 16 taxa. For RECSCAN, either raw pairwise distances (dis) or neighbor-joining (NJ) trees were inferred for each triplet. For the VisRD method, MC-simulation (sim), permutation (per) and redistribution (redis) were tested. The line represents the adjusted Rand index as an overall performance measure (secondary y-axis).

