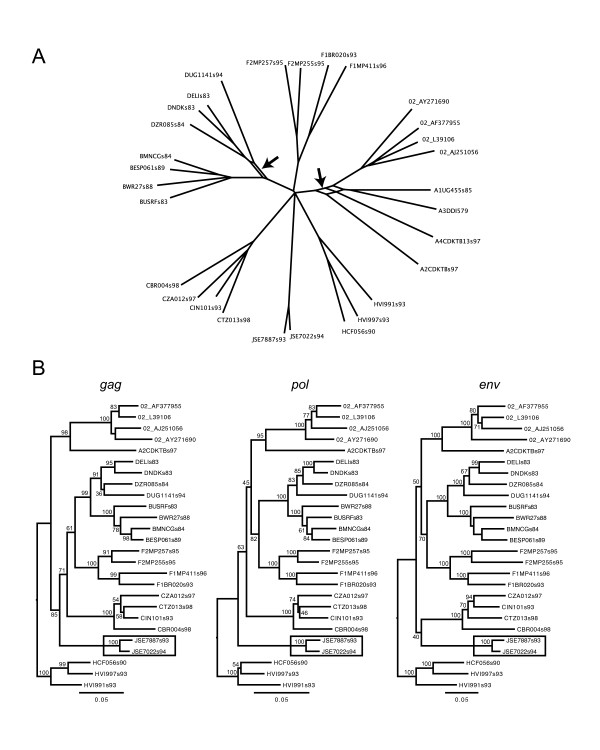
Figure 6.
HIV-1 Neighbor-net and maximum likelihood trees. (a) Neigbor-net for the HIV-1 group M data set excluding subtype G and subtype K sequences. Only splits are shown that were present in 75% of 1000 bootstrap replicates. Conflicting phylogenetic relationships are indicated with arrows. (b) HIV-1 Maximum likelihood trees for the structural genes gag, pol and env. The numbers at the nodes represent the bootstrap support percentages based on 1000 replicates. The subtype J sequences are indicated with a rectangle.

