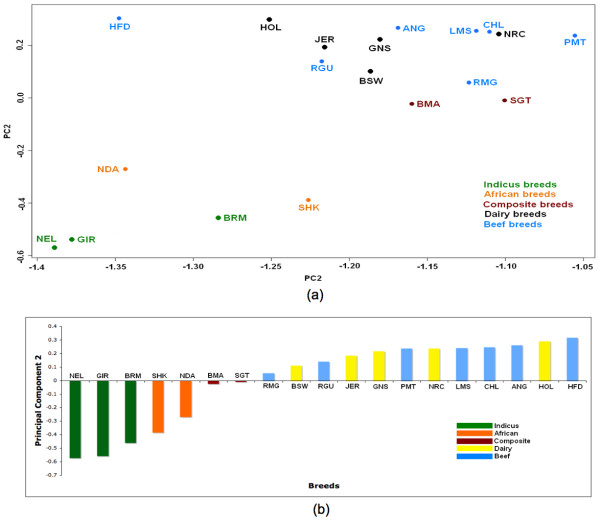
Figure 8.
Principal Component analysis. Principal Component Analysis on block boundary discordance vectors shows how different breed subgroups as indicus, African, and Composite cluster together, but there is no clear separation between dairy and beef breeds. (a) Plot of PCA1 vs PCA2. (b) Plot of PCA2.

