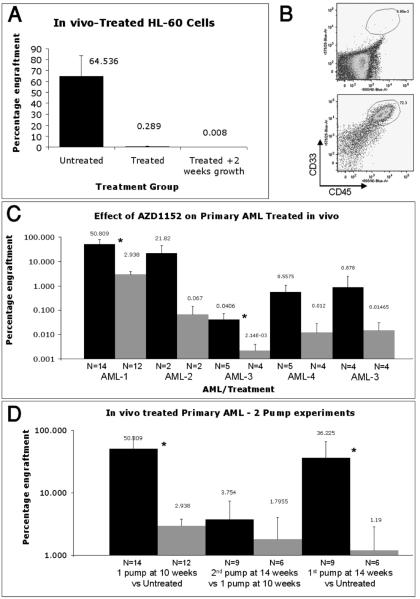
Figure 3.
In vivo effect of AZD 1152 treatment on HL-60 and primary AML. One million HL-60 cells were injected i.v. into sub-lethally irradiated mice. 4 weeks later, one group of mice were treated with AZD1152. One week after treatment the level of HL-60 xenograft were compared to untreated controls (Fig 3A). Example of FACS analysis that displays human, myeloid cell content in the murine marrows. Upper panel is from AZD1152-treated mice and lower panel is from untreated mice (Fig 3B). Three bar charts that summarize the frequency of human cells in murine marrows as a percentage of total nucleated cells. The number of mice in each group is represented by N. (Fig 3C-D). Summary of the effect of one-week (Fig 3C) and two-weeks (Fig 3D) of 25mg/kg/day AZD1152 treatment on the human cell content from various AML cases.

