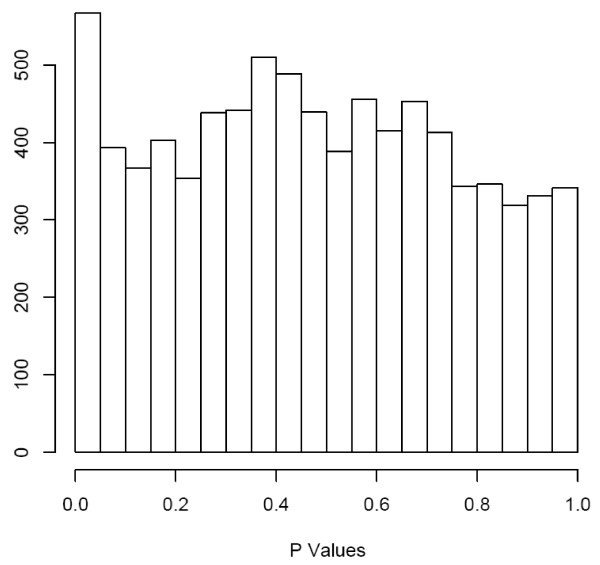
Figure 3.
The figure represents the fertility distribution of bulls used for allelic discrimination (mean ± SD). The scaling of fertility was defined as the deviation from the population average. The low-fertility bulls were scored below (negative data) the average conception rate while the high-fertility bulls scored above (positive data). The average difference between the two groups was 7.6%.

