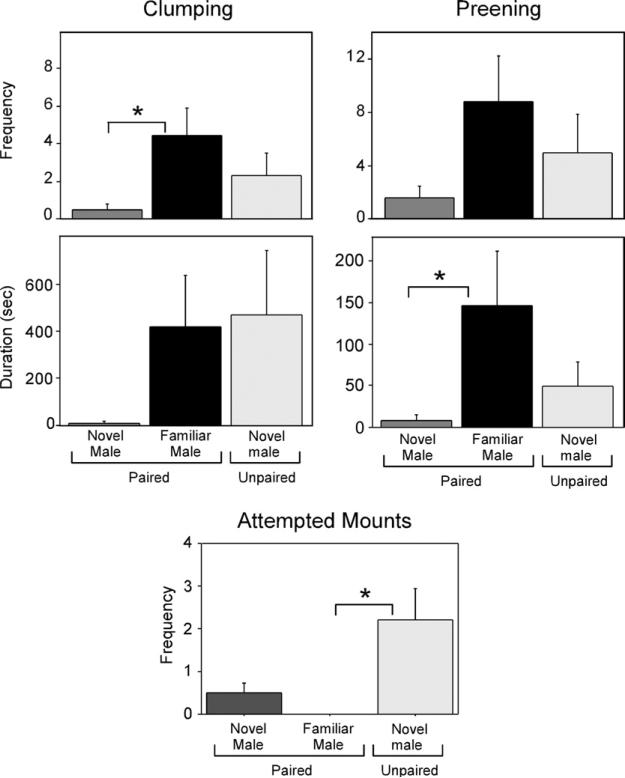
Fig. 1.
Female pairing behavior in the social interaction test. The two left panels depict the frequency (top) and duration (bottom) of clumping to the male. The right two panels depict the frequency (top) and duration (bottom) of preening the male. The bottom center panel depicts attempted mounts by the male. * Signifies P<0.05.

