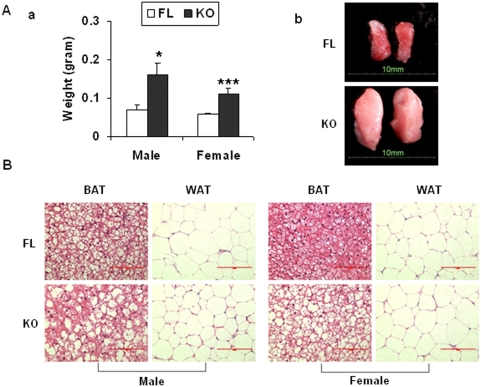
Figure 4. Brown adipose tissue abnormality in OGR1 KO mice in the mixed background.
(A) Brown adipose tissues in the KO mice were larger than those in FL mice. (a) Weights of BAT (9 mice from FL and 9 mice from KO). (b) Representative appearance of BAT from FL and KO mice. (B) H & E staining of BAT and WAT in FL and KO mice. * represents a P value of <0.05, and *** represents a P value of <0.001. Scale bar = 100 µm.

