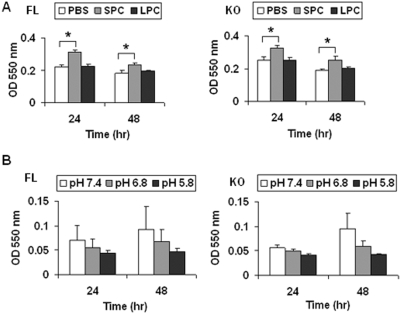
Figure 5. Proliferation of brown adipose tissue-derived cells in OGR1 KO mice in the mixed background.
(A) SPC stimulated proliferation was not significantly different in BAT from FL vs. KO mice. SPC (2.5 µM) or LPC (2.5 µM) was used. (B) The effect of pH on proliferation was not significantly different in FL vs. KO. The results in this figure are representative of at least 3 independent experiments. * represents a P value of <0.05.

