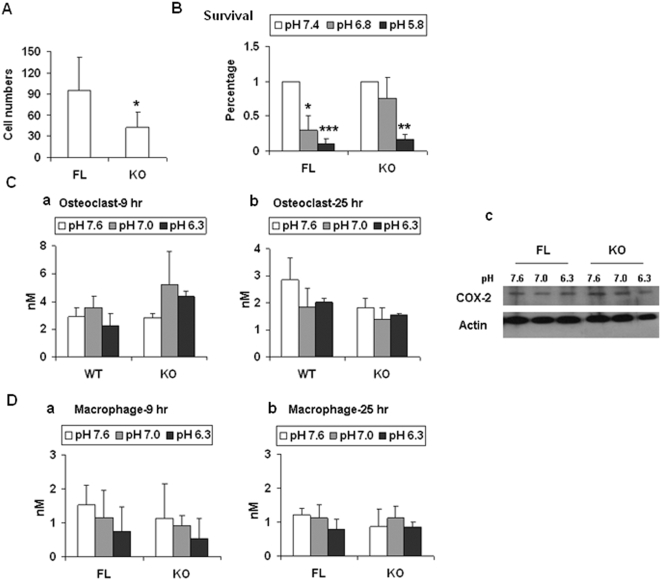
Figure 9. Reduced osteoclasts differentiated from bone marrow cells in OGR1 KO mice.
(A) M-CSF and RANKL-induced osteoclast numbers in OGR1 KO mice were reduced. (B) pH effects on survival of osteoclasts. Osteoclasts were cultured in medium with different pH for 20 hr. (C) Prostaglandin production and COX-2 expression in osteoclasts. Osteoclasts were cultured in different pH buffer (300 µL) in 24-well plates for indicated times and the supernatants were collected for prostaglandin analysis (a and b) and the cells were lysed for COX-2 expression analysis at 9 hr (c). The differences in different groups are not statistically significant (P>0.05). (D) Prostaglandin production in macrophages. The results in this figure are representative of at least 3 independent experiments. * represents a P value of <0.05, ** represents a P value of <0.005, and *** represents a P value of <0.001.

