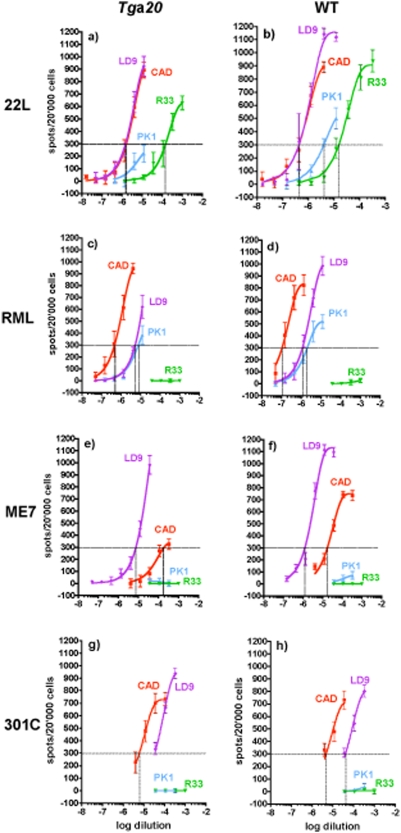
Figure 3. The Cell Panel Assay of four prion strains propagated in Tga20 or wild-type mice results in similar relative Response Indices on four cell lines.
CAD5 (red), PK1 (blue), R33 (green) and LD9 (violet) cells were exposed to 1∶3 serial dilutions of 0.1% brain homogenates infected with 22L (a,b), RML (c,d), ME7 (e,f) or 301C (g,h) propagated in Tga20 mice (a,c,e,g) or wild-type mice (b, f, h, C57BL/6; d, CD1). The number of PrPSc-positive cells (“spots”) is plotted against log[dilution] of the brain homogenate. The Response Index (RI1.5%/3) of a cell line for a prion strain (vertical dotted line) is the concentration (reciprocal of the homogenate dilution) that yields 300 spots per 20'000 cells (1.5% PrPSc-positive cells) after the 3rd split (horizontal dotted line). The “RI ratio” of a strain is the RI on a cell line relative to that on LD9; it was very similar for each strain regardless of whether it was propagated in wild-type or Tga20 mice (see Table S1 for RI values).

