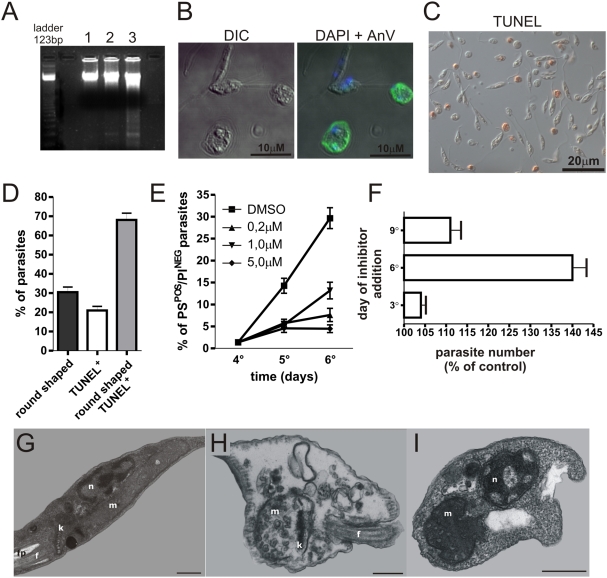
Figure 5. PSPOS parasites are apoptotic cells.
(A) Oligonucleosomal DNA cleavage in logarithmic phase (lane 1), stationary phase (lane 2) and purified metacyclic (lane 3) promastigote populations. (B) Differential interference contrast (left panels) and confocal microscopy (right panels) Confocal image of purified metacyclics stained with AnV-Alexa 488 and DAPI. (C) TUNEL staining of stationary-phase promastigotes. (D) Quantification of TUNELPOS and round shaped parasites by counting at least 200 parasites per slide under the microscope. (E) PS exposure by PINEG parasites treated with a pan-caspase inhibitor Z-VAD-FMK. (F) Proliferation of parasites treated with 10 µM of Z-VAD-FMK at day 3, 6 and 9 of culture. Ultrastructural analysis of (G) metacyclic promastigote and (H and I) PSPOS metacyclics showing morphology of nucleus (n), mitochondrion (m), kinetoplast (k), flagellar pocket (fp) and flagellum (f). Bars represent 1 µm.

