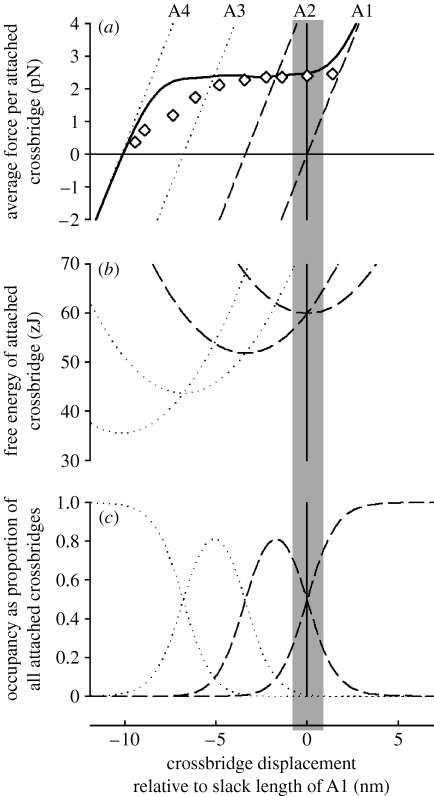
Figure 5.
(a) Force, (b) free energy, (c) occupancy for each of the four states of the attached crossbridges at 2°C. States A1 and A2 are shown by dashed curves and the other states by dotted curves. The shaded area is the region within which crossbridges can attach in isometric contraction. The thick curve in (a) is the force of the equilibrium mixture of the four crossbridge states. Diamonds show observations of T2 from Piazzesi et al. (2003). This diagram is built up as follows. From the proportion of crossbridges attached (35%), the stiffness of the attached crossbridge states is found by dividing the observed stiffness (solid line, figure 2b) by 0.35. This allows the dashed force curve for A1 to be drawn. The value of z is then used to draw the curve for A2 offset by 3.4 nm. The two dotted curves (A3, A4) are added with the same offsets. From the slope of these curves, the shape of the curves relating free energy to length is found. Since it is observed that A1 and A2 have equal free energy at x=0 (at 2°C), these two curves are offset vertically to cross at x=0, as shown in (b). The other free energy curves are added in a similar way. The occupancy of each state is calculated from the free energy (ΔG) curves using the Boltzmann distribution (see box S6 in the electronic supplementary material) The force of the equilibrium mixture of attached states (solid curve in (a)) is the weighted mean of the forces of the individual states, using the occupancy as the weighting factors.

