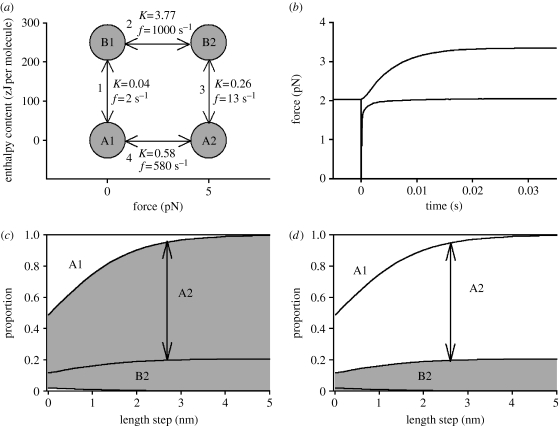
Figure 7.
(a) The enthalpy content and force-producing capacity of four attached crossbridge states. States A1 and A2 are the same as in figure 5; the forces shown here are those at x=0 in figure 5a. States B1 and B2 are mechanically the same as states A1 and A2, respectively, but have different enthalpy contents. For simplicity, states A3 and A4 in figure 5, and the corresponding states B3 and B4, are not included here although they would be needed for a full simulation of the length-step and temperature-jump experiments. K values shown are the equilibrium constants assumed; f values are rate constants for the ‘forward’ reaction (i.e. upwards or rightwards on this diagram). (b) Simulated force responses to a temperature jump (upper curve) and to a length step (lower curve). (c,d) Distribution of attached bridges among states A1, B1, B2 and A2 as a function of length steps of various sizes. The proportion in each state is the vertical distance between the curves; for example, the arrow shows the proportion in state A2 after a step of 2.6 nm. In (c) the high force states (A2 and B2) are shaded, and the low force states (A1 and B1) are unshaded. In (d) the high enthalpy states (B1 and B2) are shaded, and low enthalpy states (A1 and A2) are unshaded.

