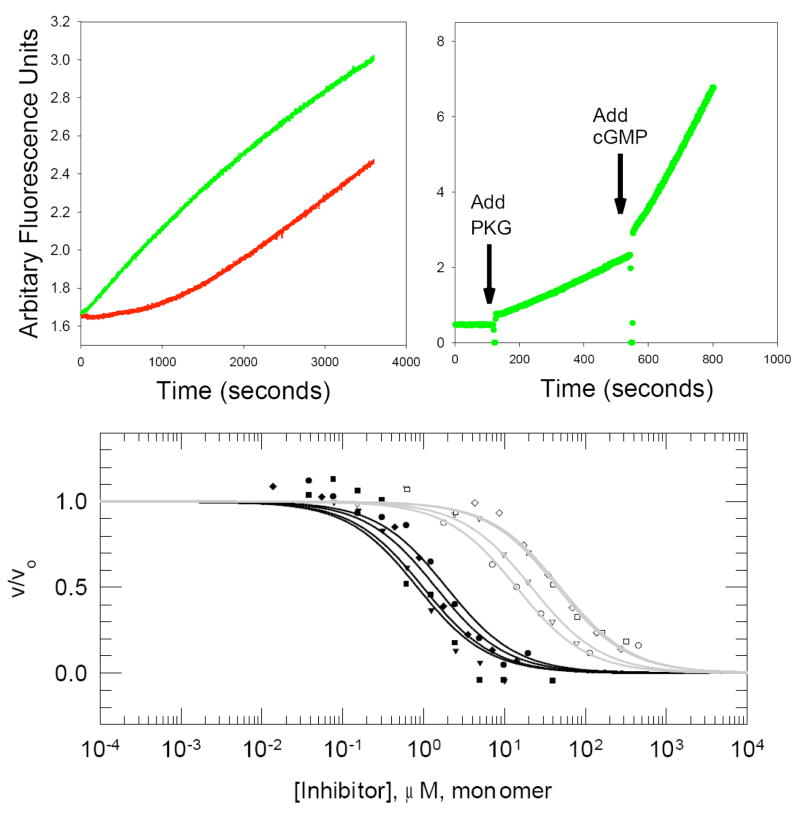
Figure 5.
Sensor applications. (A) Autophosphorylation of Blk kinase: The initial lag-period seen with Blk-catalyzed phosphorylation (red curve) was eliminated by pre-incubating the Blk enzyme with ATP (green curve). (B) Small molecule activation of PKG: Addition of enzyme to the reaction cuvette gives a rate of product formation, which is significantly enhanced upon the addition of cGMP. (C) The activity of a wide array of kinases can be examined using a single sensing system. The response of eight tyrosine kinases was assayed at different inhibitor concentrations. Fitted curves for Group A enzymes (Src, Yes, FynT and Fgr) are shown in black while fitted curves for Group B (Hck, Blk, LynA and Lck) enzymes are shown in gray. Src (closed circle), Yes (closed triangle), FynT (closed square), Fgr (closed diamond), Hck (open circle), Blk (open triangle), LynA (open square) and Lck (open diamond).

