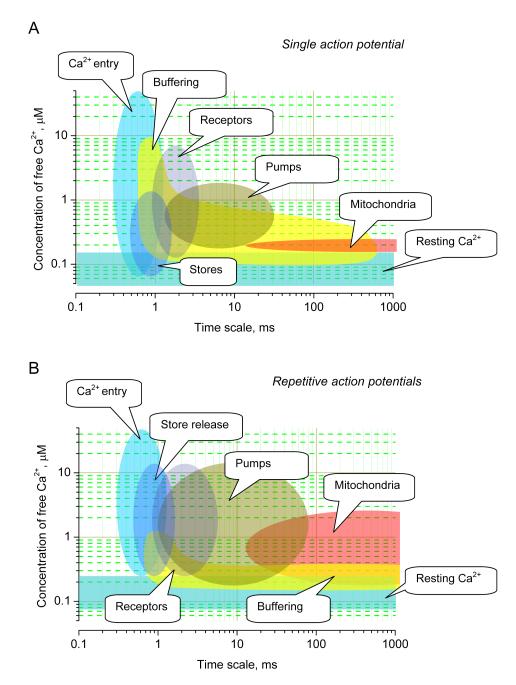
Figure 3.
A diagram illustrating the dynamic range - time domain relationship for major cellular mechanisms that shape the dynamics of presynaptic Ca2+.
The abscissa indicates relative contribution in terms of the affected concentration range of free intra-terminal Ca2+ in response to a single AP (A) and repetitive APs (B).

