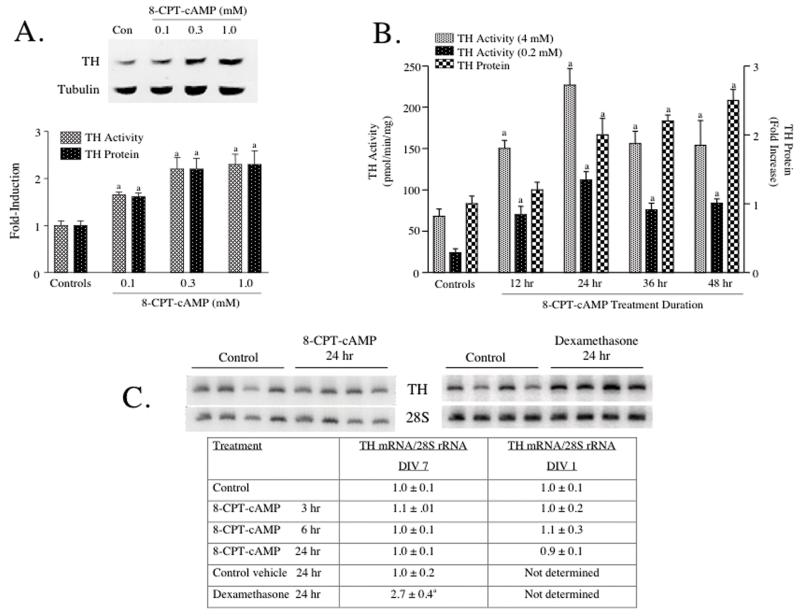
Figure 1. TH activity and TH protein, but not TH mRNA were induced in cultured rat midbrain slices by treatment with 8-CPT-cAMP.
(A) Midbrain slices were treated for 24 hr with 8-CPT-cAMP at the concentrations designated in the figure. Control slices were left untreated. (B) Midbrain slices were treated with 1 mM 8-CPT-cAMP for the durations of time designated in the figure. Control slices were left untreated. All slices were harvested at the same time, quick-frozen and stored at -80°C. TH activity was assayed using 4 mM 6MPH4 in panel A and either 0.2 mM or 4 mM 6MPH4 in panel B. Control TH activity in panel A was 27 ± 3 pmol/min/mg protein. TH protein was measured using western analysis. An autoradiogram depicting a representative western blot is shown above the bar graphs in panel A. The results in panels A and B represent the means ± SE from 3-6 slice cultures. (C) Midbrain slices were treated with 1 mM 8-CPT-cAMP or 0.1 uM dexamethasone for the durations of time designated in the figure. Control cultures were left untreated or treated with vehicle (dimethylsulfoxide). All cultures were harvested at the same time, quick-frozen and stored at -80°C. Total cellular RNA was isolated and TH mRNA was assayed using semiquantitative RT-PCR. Autoradiograms depicting representative RT-PCR assays are shown for midbrain slice cultures (DIV 7) treated for 24 hr with either drug. The data in the table represent values for TH mRNA divided by those for 28S rRNA measured in the same samples and expressed as fold-increase over controls. The data represent the means ± SE from 6-12 midbrain slices for the 8-CPT-cAMP experiments and 4 midbrain slices for the dexamethasone experiments.
a: p < .05 compared to controls

