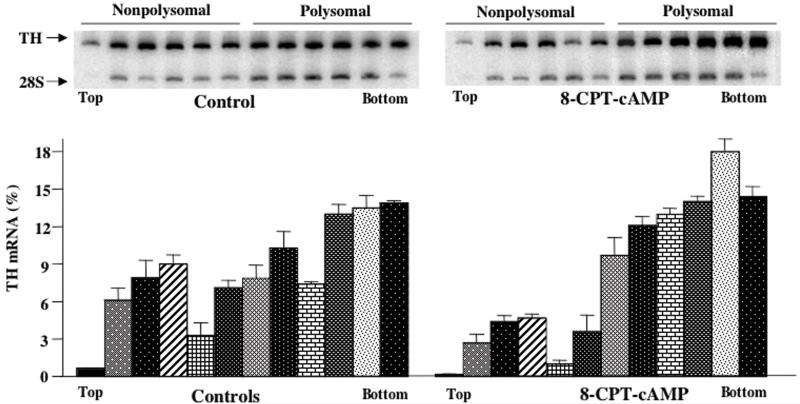
Figure 4. Polysome profile analysis of MN9D cell TH mRNA.
MN9D cells were either untreated or treated with 1 mM 8-CPT-cAMP for 24 hr. Cytoplasmic extracts were prepared and fractionated by sucrose gradient centrifugation. RNA was isolated from each fraction and TH mRNA and 28S rRNA levels were measured using semiquantitative RT-PCR assays. Autoradiograms of representative RT-PCR assays are shown in the top panels. The densities of the images in the autoradiograms were quantitated using Phosphorimager analysis and TH mRNA levels in each fraction were expressed as a percentage of total levels summed over all 12 fractions. The results represent the means ± SE from 3 experiments.

