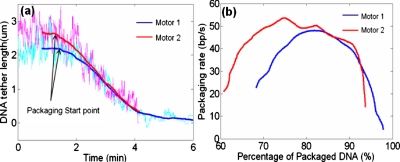
Figure 3.
(a) DNA tether length against time for two different motors. Bold curves are 500-point moving averages of the light-colored raw data (curves have been shifted on time axis). (b) DNA packaging rate against the amount of DNA packaged relative to the original phi29 DNA length (19.3 kbs). The rates were observed by differentiating the bold curves in (a) and computing 250-point moving averages.

