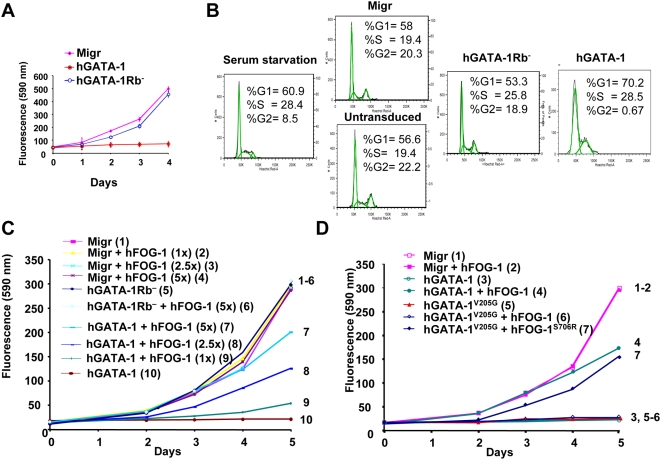
Figure 3. GATA-1/pRb interaction is required for GATA-1–mediated G1/S phase arrest of cell proliferation, which is antagonized by FOG-1 in vitro.
(A) Retroviral vectors encoding wt hGATA-1 or the hGATA-1 mutant that cannot interact with pRb (hGATA-1Rb−) were used to transduce NIH-3T3 cells, and proliferation of the eGFP-positive NIH-3T3 cells was monitored each day for 4 d by means of the fluorimetric metabolic growth indicator Uptiblue (Interchim) (n = 6). Migr indicates NIH3T3 cells transduced with the “empty” retroviral vector (Migr vector), which only expresses eGFP. We verified that >90% cells were successfully transduced by each of the retroviral vectors on the basis of coexpression of eGFP from an IRES. (B) Cell cycle analysis of NIH3T3 cells transduced with a retroviral vector (Migr) expressing hGATA-1 or hGATA-1Rb−. Transduced cells were synchronized during a 72-h culture in the presence of 1% FCS (serum starvation) and subsequently serum stimulated for 48 h in the presence of 10% FCS. The distribution of cells in G0/G1, S, and G2/M phases was evaluated by measuring their DNA content by cytofluorometry following Hoechst 33342 (Molecular Probes/Invitrogen) staining. The percentage of cells in the different phases of the cell cycle was evaluated as described in Materials and Methods. (C) NIH-3T3 cells transduced with either an “empty” retroviral vector (Migr) or one that encodes hGATA-1 or hGATA-1Rb− were transiently transfected with increasing amounts (1- to 5-fold) of a hFOG-1 expression plasmid and the proliferation of the cells monitored for 5 d by Uptiblue reagent (Day 0 corresponds to the day of the FOG-1 plasmid transfection). We verified that >90% cells were successfully transduced by each of the retroviral vectors on the basis of coexpression of eGFP from an IRES. To increase legibility, curves are numbered 1 to 10 as well as represented with different colors. (D) NIH-3T3 cells, transduced with either an “empty” retroviral vector (Migr) or a retroviral vector that expresses hGATA-1 or hGATA-1V205G, were transiently transfected with the same amount of hFOG-1 or hFOG-1S706R. We verified that >90% cells were successfully transduced by each of the retroviral vectors on the basis of coexpression of eGFP from an IRES. Cell proliferation was monitored each day for 5 d by Uptiblue (Day 0 corresponds to the day of the FOG-1 plasmid transfection). Two independent experiments gave a similar result (n = 6 for each experiment). To increase legibility, curves are numbered 1 to 7 as well as represented with different colors.

