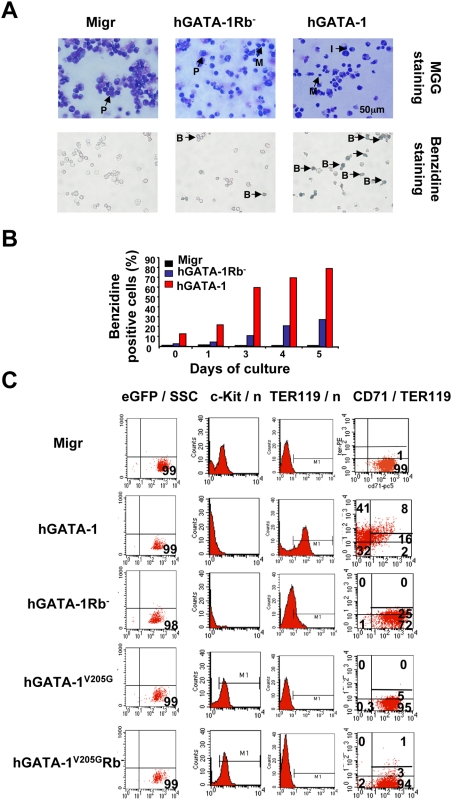
Figure 5. GATA-1, FOG-1, and pRb/E2F-2 interplay regulates the differentiation of G1E cells.
(A) GATA-1–deficient G1E cells were transduced with either an “empty” retroviral vector (Migr) or one that encodes hGATA-1 or hGATA-1Rb−. Transduced G1E cells were first sorted for eGFP expression. We verified that the sorted population was >95% eGFP positive. Cell differentiation was examined on Day 4 posttransduction by May-Grünwald-Giemsa (MGG) (top) and benzidine (bottom) staining. Proerythroblast, intermediaries, mature erythroblast, and benzidine-positive cells are indicated as P, I, M, and B, respectively. (B) Graphic representation of benzidine-positive G1E cells after retroviral transduction (eGFP-sorted population). The percentage of benzidine-positive cells was monitored for 5 d. (C) Erythroid differentiation of G1E cells transduced with an empty retroviral vector (Migr) or one that expresses hGATA-1, hGATA-1Rb−, hGATA-1V205G, or hGATA-1V205GRb− was assessed, after 6 d in culture, by flow cytometry analysis for c-Kit, TER119, and CD71 expression. Transduced G1E cells were first sorted for eGFP expression. Panels on the left column confirmed that sorted cells were >98% positive for eGFP expression. The x- and y-axes are indicated at the top of the panels (SSC = side scatter; n = cell counts). For panels in the left column, TER119high and TER119low are delineated.

