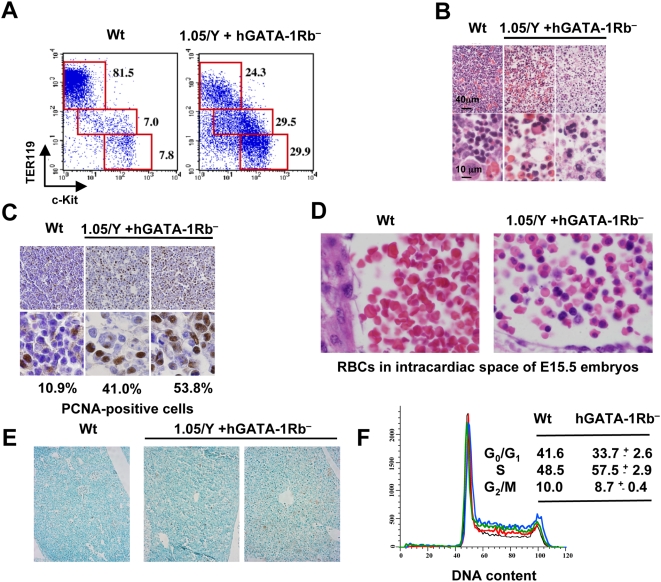
Figure 7. Analysis of fetal hematopoiesis in 1.05/Y+hGATA-1Rb− mice.
(A) Analysis by flow cytometry of liver cells from E13.5 Wt or 1.05/Y+hGATA-1Rb− embryos. Cells were labeled with c-Kit and TER119 Abs, showing a decrease in the proportion of TER119+/c-Kit− mature erythroblasts with compensatory increase in proerythroblasts and earlier erythroid precursors. (B) Liver sections from E15.5 wt or 1.05/Y+hGATA-1Rb− embryos stained with hematoxylin and eosin show a decrease in the number of erythroid cells (top) with evidence of abnormal erythroblasts having lobulated nuclei at higher magnification (bottom). (C) Immunohistochemical analysis for Proliferating Cell Nuclear Antigen (PCNA) in liver sections from E12.5 wt or 1.05/Y+hGATA-1Rb− embryos. High magnification panels (bottom) show that the proportion of PCNA-positive cells among erythroblasts is higher in 1.05/Y+hGATA-1Rb− embryos than in wt embryos. (D) Hematoxylin and eosin analysis of red blood cells in the intracardiac space of E15.5 embryos. (E) Immunohistochemical analysis for Terminal dUTP Nick-End Labeling (TUNEL) assay to detect apoptotic cells in liver sections from E12.5 wt or 1.05/Y+hGATA-1Rb− embryos. (F) Cell cycle distribution in hGATA-1Rb− mice. DNA content analysis of CD71-positive cells from livers of e12.5 wt (black line) and individual 1.05/Y+GATA-1Rb− embryos (red, green, and blue lines). Percentages of each subpopulation of cells in G0/G1, S, and G2/M phases are indicated.

