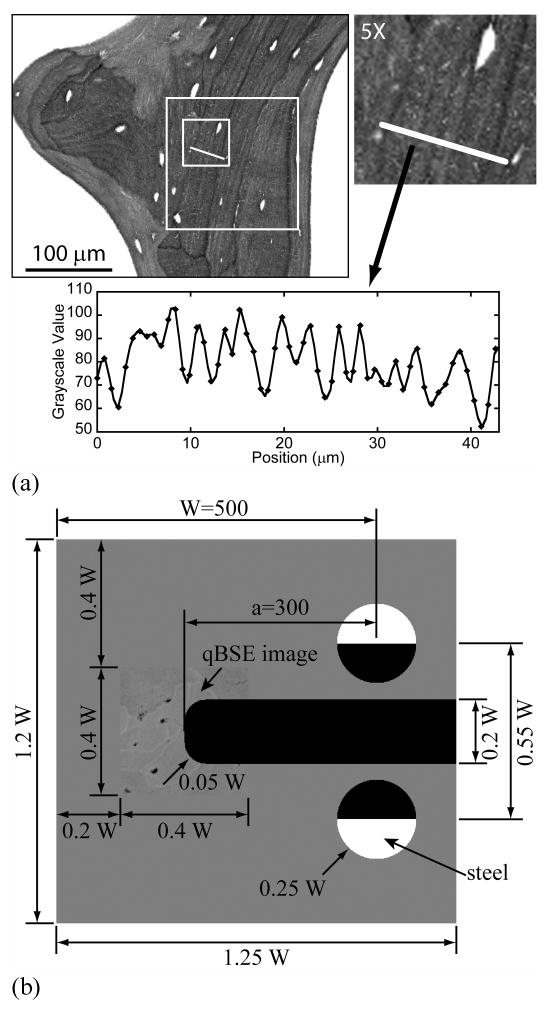
Figure 1.

(a) A 200×200 pixel region (white box) was cut from a qBSE image of human iliac cancellous bone. The distribution of bone mineral as grayscale values is plotted below. (b) A compact tension specimen finite element model was used in biomechanical stereology. Dimensions of the compact tension FE model were plotted. Cancellous bone qBSE image was used to replace the tip regions. The unit of the image is pixel, while each pixel is equals to 0.756 mm in the finite element model.
