
Figure 4.
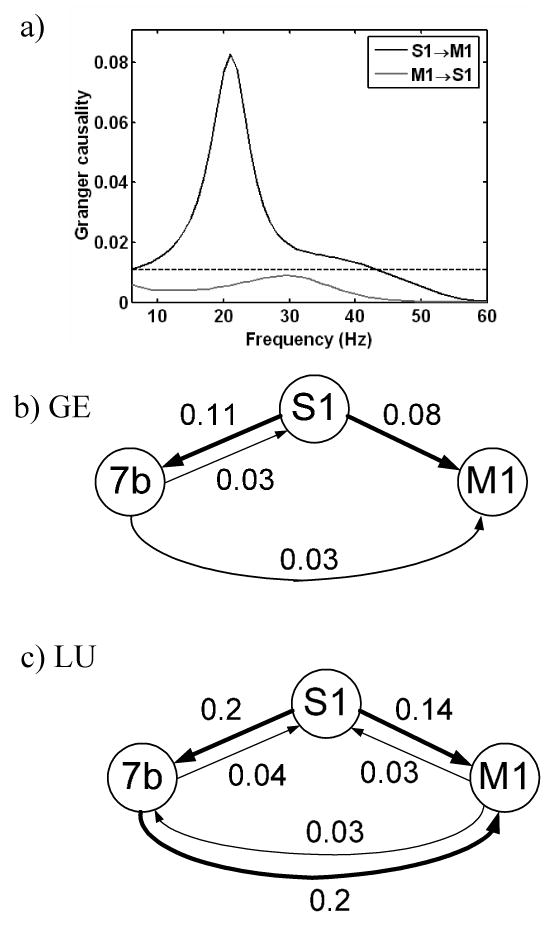
Results of Granger causality analysis. Granger causality spectra for S1→M1 and M1→S1 in GE (a). The horizontal dashed line indicates significance threshold. Schematic diagrams of Granger causal influences during the recurrence window in GE (b) and LU (c). The thickness of the lines between recording sites and the numbers near the lines indicate the Granger causality values in the beta band. The arrowheads indicate the direction of Granger causal influence. S1: primary somatosensory cortex, 7b: posterior parietal cortex, and M1: primary motor cortex.