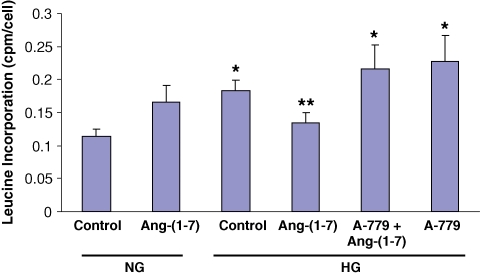
Fig. 6.
Ang-(1–7) inhibits high glucose-stimulated cell protein synthesis. Graph depicts the effect of Ang-(1–7) (10−7 M) in normal glucose (NG, 5 mM) and high glucose (HG, 25 mM) for 48 h, with or without A-779 (10−5 M) on cell protein synthesis, measured by [3H]-leucine incorporation. *P < 0.001 versus NG control, **P < 0.001 versus A-779 + Ang-(1–7), P < 0.010 versus HG control, and P < 0.030 versus HG + A-779; n = 5–11.

