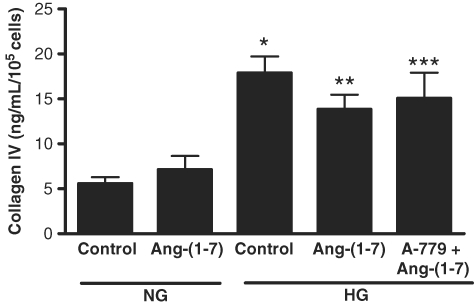
Fig. 9.
Effect of Ang-(1–7) on collagen IV production. Graph depicts the effect of Ang-(1–7) (10−7 M) on collagen IV production in normal glucose (NG, 5 mM) and high glucose (HG, 25 mM) for 72 h, with or without A-779 (10−5 M). Collagen IV synthesis was measured by ELISA. *P < 0.001 versus NG control, **P < 0.05 versus NG control, ***P < 0.01 versus NG control; n = 7.

