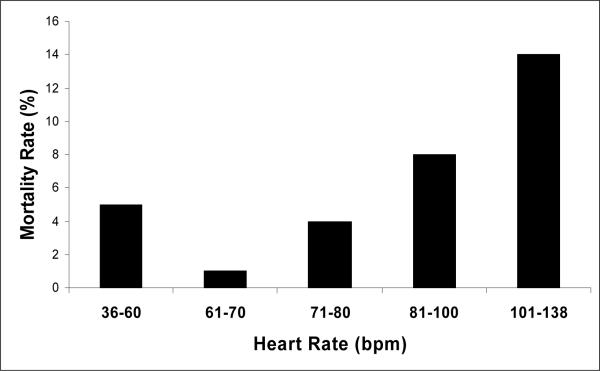
Figure 1.
The Y axis indicates the unadjusted 3 month mortality rate. The first three bars from the left on the X axis indicate the lower three quartiles quartiles of heart rate on the pre-operative ECG. The top quartile is divided in the figure into 81−100 bpm (N=127)and 101−138 bpm (N=22). The combined mortality rate for the top quartile was 9%. A non-linear relationship is demonstrated as the lowest and highest heart rate quartiles are associated with the highest mortality rates.

