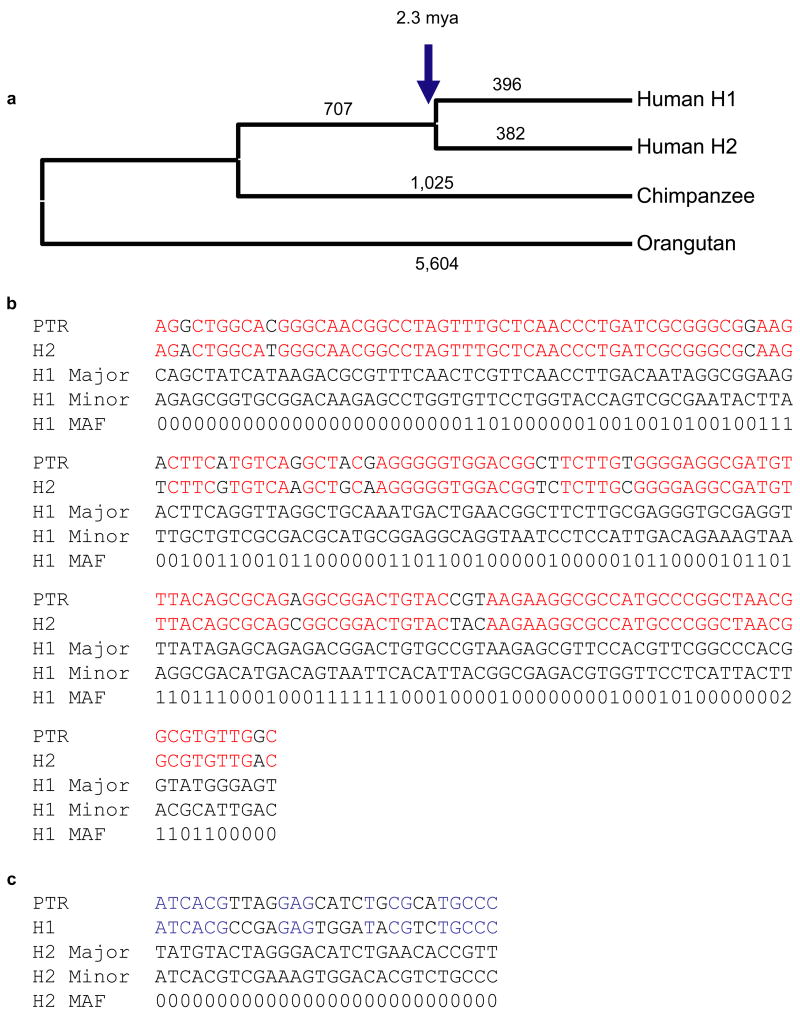
Figure 4. Phylogenetic and SNP haplotype analysis.
(a) An unrooted neighbor-joining phylogram was constructed (MEGA pairwise deletion option, sum of branch lengths=0.0414) based on 219,165 aligned basepairs from unique sequence within the inverted region. H1 and H2 sequence taxa clustered together with 100% bootstrap support (n=500 replicates). The number of single-nucleotide variants specific for each branch in the tree is assigned above each branch. We estimate that the H1 and H2 haplotypes diverged 2.3 million years ago (Table 2). (b, c) We treated H1 and H2 haplotypes as separate populations in the analysis and identified a total of 320 SNPs that were fixed in one haplotype but polymorphic in the other. We assessed the likely ancestral state of each SNP through a comparison with the sequenced chimpanzee haplotype. For SNPs that are monomorphic among H2 haplotypes but polymorphic among the H1s (b), we found that the allele found in the H2 haplotypes matched the chimpanzee allele 90% of the time (150/166 considered positions). For SNPs that are monomorphic among H1 haplotypes but polymorphic among the H2s, the allele found in the H1 haplotypes matched the chimpanzee 60% of the time (17/28 considered positions) (c). Red indicates alleles shared between chimp and H2, while blue delineates shared alleles between H1 and chimpanzee. The major and minor alleles are denoted with the minor allele frequency represented by a single digit. For example, 4 refers to a minor allele frequency of ≥ 40%.

