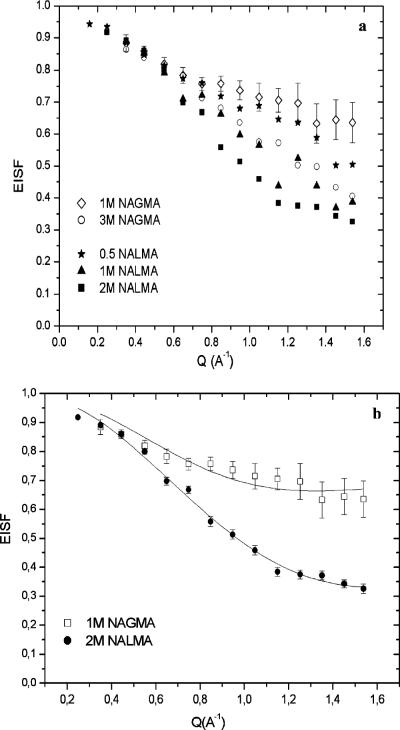
Figure 4.
(a) EISF of hydration water plotted vs Q for 1.0 and 3.0 M NAGMA and 0.5, 1.0, and 2.0 M NALMA concentrations. (b) EISF of hydration water for 2.0 M NALMA and 1.0 M NAGMA concentrations with the fit to eq 7 of the text. The solid lines are the fits, with the fraction of immobile protons p and the radius a given in Table 1.

